Faq : frequently asked questions1) What's Piecolor ?This website is a web tool that makes Pie chart = circle graph.
A Pie chart represents proportion of an information, example : percentage of users of differents browsers (like Internet explorer, Chrome, Firefox, Safari, Opera...). It will be easy to illustrate on your blog this information if you need too. A slice of a pie chart will represent the element (here a browser name). 2) How can i create a pie chart ?It's easy : you got a form where you have to enter the number of slices, you want.
After this, you will see a form with Values and Options to complete in order to generate a pie chart. You have to fill the name of each slice, the percentage, and the colors. You can change options like text size, title, 3d or 2d, the font, and even the size of the pie chart. 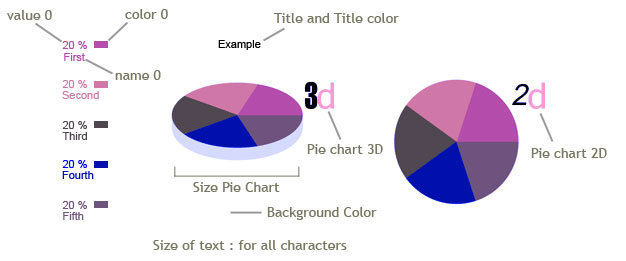 Title and Title Color can be empty if you don't need a title for the pie chart. Name field limit is 50 characters max. If you use decimal number with % ex : 20.3 use always the point . and not the coma , 3) Is it possible to edit pie chart, once generated ?Yes you can go back to form and change values, options, very easy and useful when you need to adjust the pie chart.
4) How can i get the final result : the pie chart picture ?You can download the picture to your computer, or directly get embed code to post on your blog....
5) Do you store pie chart picture into your server ?No i don't they are erased each day, so just download or use embed options to store it to your computer or blog...
6) Can i use chinese or japanese character into pie chart ?Yes, there are 2 asians fonts : you just have to select into the font list.
|
 Back home
© 2024 - Piecolor.com - V1.7 - Contact